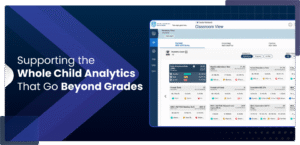
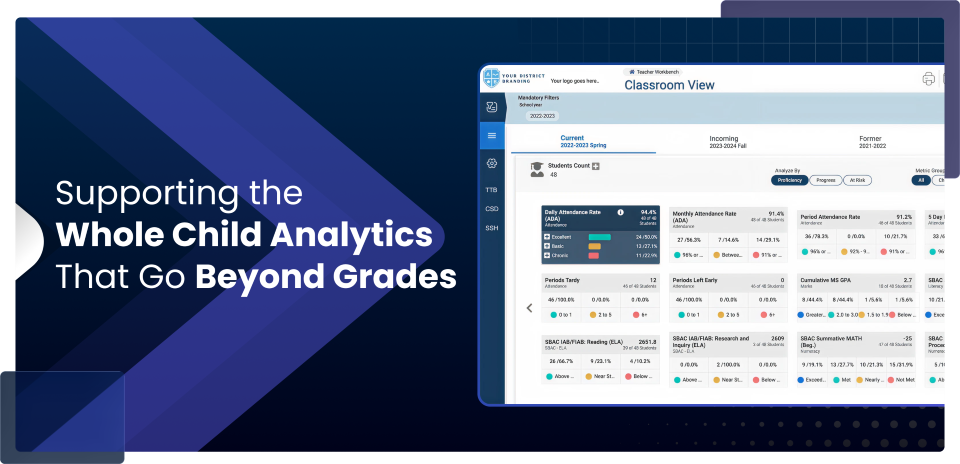
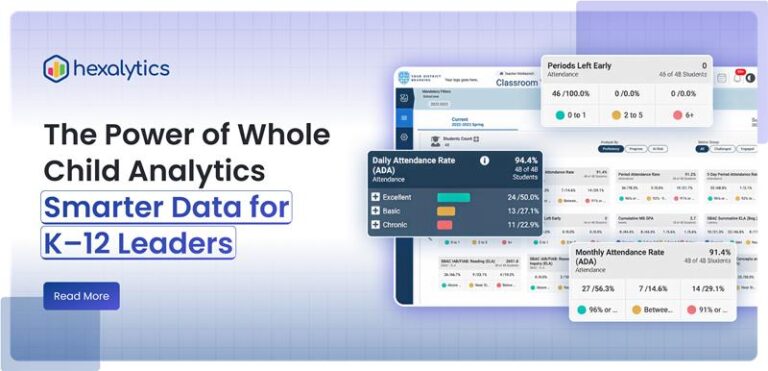
Supporting the Whole Child Analytics That Go Beyond Grades

Recent reporting from K–12 Dive and EdWeek reveals a clear truth across school systems. Chronic absenteeism is still elevated. Student mental health needs continue to rise. Districts now collect more social and emotional learning data than ever before, yet leaders still struggle to convert these signals into timely, coordinated action.
Federal policy reflects this urgency. In late 2025, the U.S. Department of Education awarded more than $200 million in school-based mental health grants. Districts are expanding counseling teams, launching SEL initiatives, and rethinking support models. Resources are shifting, expectations are rising, and the pressure to demonstrate real impact is intensifying.
Even as investments grow, most districts still view attendance, SEL, behavior, health, and equity data in siloed systems. Leaders see fragments of the picture, but rarely the full story.
The challenge is not data scarcity. The challenge is fragmentation.
For decades, student success was defined by test scores, grades, and growth charts. These academic metrics remain essential, but leaders now recognize a fundamental limitation. Academic data reveals what happened. It rarely reveals why it happened.
Student outcomes are shaped by an interconnected set of experiences and conditions:
Attendance patterns
Social and emotional readiness
Health barriers
Behavioral experiences
Family and economic stability
When these indicators live in isolation, leaders see symptoms rather than root causes.
A spike in absenteeism may reflect anxiety, caregiving responsibilities, or housing instability. Behavior referrals may be early signs of disengagement or lack of connection.Declining engagement often emerges weeks before academic decline.
Whole Child dashboards do not replace academic performance. They unlock the context leaders need to intervene earlier, plan strategically, and support students more effectively.
Frameworks such as ASCD’s Whole Child model and the federal WSCC framework emphasize that students must be healthy, safe, engaged, supported, and challenged in order to learn. This philosophy is now shaping policy, funding, and accountability expectations.
Districts are building stronger student support teams. Boards want clear evidence of impact. Superintendents are expected to identify emerging risks early, not report on issues months after they occur.
This shift demands clearer, more connected insight than traditional reporting can provide.
Whole child analytics close this gap by transforming fragmented signals into decision-ready insight. A modern Whole Child data analytics platform gives district leaders a unified way to understand how academic, SEL, behavior, health, and equity indicators intersect.
A true K–12 student success dashboard brings every dimension of the student experience into one connected view that supports faster, more confident decisions. Many dashboards are marketed as “360° views,” yet very few provide true Whole Child intelligence. A real Whole Child dashboard integrates multiple domains into a clear, connected, leadership-level view that reflects the complexity of student experience.
Academic Performance : Anchors the student story with grades, assessment trends, and growth indicators.
Attendance : Identifies emerging risk through daily patterns and chronic absenteeism indicators.
Social Emotional Learning : Surveys surface belonging, resilience, stress, and engagement when paired with context.
Behavior and Discipline : PBIS indicators and referral patterns reflect student experience and climate
Health Indicators : Screenings, nursing visits, counseling referrals indicators reveal readiness to learn.
Poverty and Access Indicators : Free and reduced lunch status, homelessness, language access, and special education data reveal inequities that influence every outcome.
Viewed together, these signals produce a holistic, timely picture that isolated reports can never deliver. A Whole Child 360 dashboard for schools replaces siloed reporting with an integrated view that helps leaders act earlier and with greater clarity.
Whole Child dashboards are not built for analysts. Effective leadership depends on strong K–12 data integration and analytics capabilities that unify information from systems that traditionally do not communicate.
They are built for the people responsible for strategy, governance, and student success. For superintendents, cabinet members, and boards, integrated dashboards enable three critical outcomes.
Early Visibility : Leaders can detect emerging risk before it becomes an academic problem. Patterns become clear. Blind spots disappear.
Strategic Alignment : Attendance, SEL, behavior and equity initiatives are viewed through one shared lens. This drives consistent decision-making across departments.
Resource Stewardship : Leaders can demonstrate whether investments in counseling, SEL, mental health, or student support are producing measurable improvement.
This is the difference between monitoring programs and governing systems of support.
Districts are entering a defining period. Federal relief funding is tapering. Mental health investments are expanding. Boards are demanding evidence of effectiveness.
Disconnected reports cannot provide these answers.
Whole Child dashboards represent a shift from reactive leadership to proactive governance. From fragmented views to connected insight. From academic-only metrics to student-centered decision-making.
Leadership requires clarity. Clarity requires a connected view of every student.
Hexalytics helps school districts transform complex, multidimensional data into leadership-ready intelligence. Our Whole Child dashboards integrate academic, attendance, SEL, behavior, health, and equity data into a unified view designed for superintendents, boards, and district leadership teams.
By moving beyond grades, Hexalytics enables earlier insight, stronger alignment, and smarter decisions that improve outcomes for every student.
A Whole Child data dashboard provides a connected view of academic, SEL, attendance, behavior, health, and equity indicators. It helps district leaders understand why student outcomes are changing, not just what changed.
A K–12 student success dashboard brings multiple data sources together so leaders can see early warning signs, monitor student experience, and make faster, more informed decisions that improve outcomes.
A Whole Child 360 dashboard gives districts a unified picture that replaces fragmented reports. It highlights engagement patterns, barriers to learning, and emerging risks that traditional reports often miss.
A strong K–12 data integration and analytics solution should combine academics, SEL, attendance, behavior, and equity data. It should help leaders act quickly by providing clear, connected insights across schools.
A Whole Child dashboard highlights early patterns in engagement, behavior, SEL, attendance, and academic performance, helping leaders spot emerging needs before they escalate.
A strong Whole Child data analytics platform brings together academics, SEL surveys, attendance, behavior, health records, equity data, and student services information to create a connected picture of every learner.
K–12 data integration allows districts to combine information from systems that do not normally communicate. This unified view supports stronger decision-making, earlier intervention, and more consistent leadership action.
New Data Era for Supporting the Whole Child
Why Grades Alone Are No Longer Enough
The Whole Child Shift Is Now Operational
What a True Whole Child Dashboard Must Include
From Data Collection to Leadership Action
Conclusion
FAQs
Gain real-time asset visibility with a unified K12 asset management system. Strengthen school asset tracking and management, streamline maintenance, improve accountability, reduce costs, and enhance district operations.
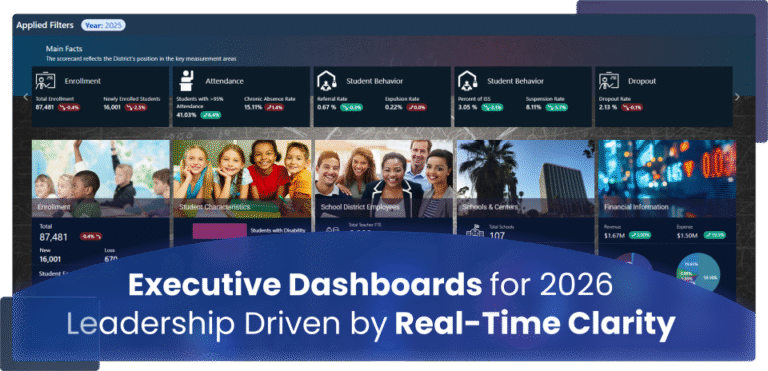
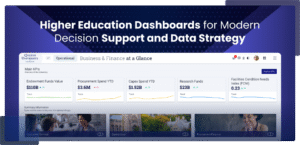
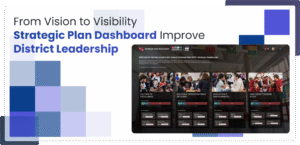
Real-time, AI-powered dashboards give K-12 and state leaders clarity to track shifts, predict risks, and make faster decisions. Explore how unified intelligence strengthens strategy, alignment, and 2026 readiness.
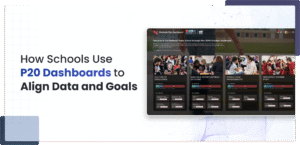
Every district leader knows the challenge: data lives in silos. Attendance data sits in one system, SEL surveys in another, and health, behavior, and academic results rarely connect. By the time problems surface, it’s often too late to intervene effectively. Next, let’s explore how districts are leveraging these dashboards to tackle their toughest challenges. That’s…
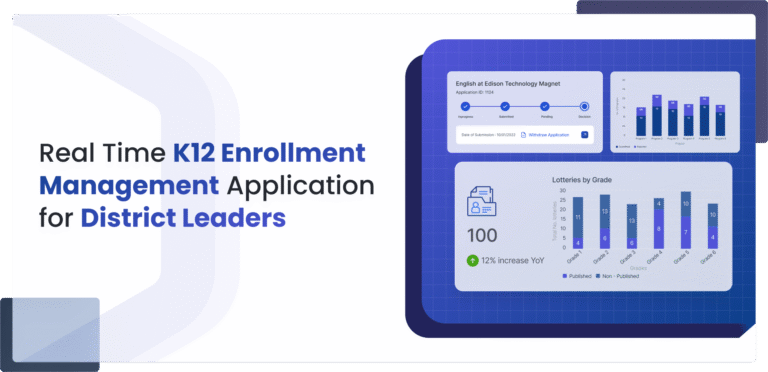
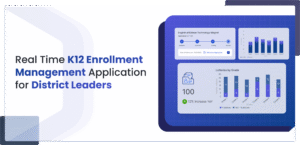
Get real-time insight with modern K-12 enrollment management software and AI-powered enrollment forecasting to help districts plan staffing, funding, and programs with confidence.
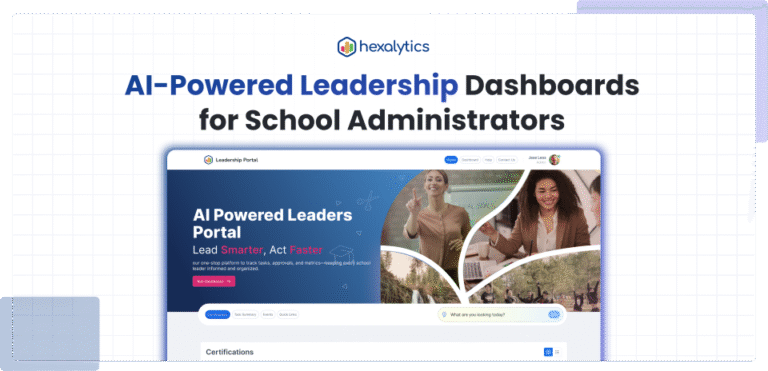
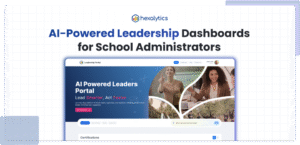
Leading with Clarity in the Age of Complexity Across the U.S., K-12 school administrators are navigating an era of expanding responsibility but diminishing clarity. From certification approvals and compliance reporting to instructional oversight and staff coordination, superintendents and principals are increasingly challenged by fragmented education data systems and disconnected workflows. A 2024 RAND Corporation study…
Across U.S. school districts, enrollment data is shaping some of the most important decisions for 2025 and beyond — from staffing and budgeting to equity and long-term planning. Yet in many districts, this data remains scattered across spreadsheets and disconnected systems, making it hard to see the full picture. This blog explores how Enrollment Analytics…